![]()
SMOS Melt detection
This dataset provides daily melt over ice sheet and ice shelves as detected from the radiometer observations in L-band carried out by the ESA SMOS satellite. The method uses an adaptive threshold to detect the daily melt occurrence in each grid point and for each year. The developped algorithm is based on the results from Torinesi et al. (2003) and Leduc-Leballeur et al. (2020).
Daily melt occurrences
The algorithm returns a daily binary indicator: 0 when no melt and 1 when melted.
The SMOS ice melt occurrence product is provided over the Equal-Area Scalable Earth version 2.0 grid (EASE-Grid 2.0; Brodzik et al., 2012) in the Southern Hemisphere Azimuthal projection. It is a daily product with a spatial resolution of 25 km x 25 km.
This product is build from the L3 SMOS brightness temperature provided by CATDS (Al Bitar et al., 2017).
Dataset available
- Antarctica: April 2010 - March 2025
Condition of use
For questions or collaborations, please to contact: smosmelt-contact@ifac.cnr.it
Information and data available on this page are provided without warranty of any kind. When using this dataset in a publication, please to cite the related work with:
Leduc-Leballeur M., Picard G., Macelloni G., Mialon A., Kerr Y. H., 2020, Melt in Antarctica derived from Soil Moisture and Ocean Salinity (SMOS) observations at L band, The Cryosphere, 14, 539–548, doi:10.5194/tc-14-539-2020.
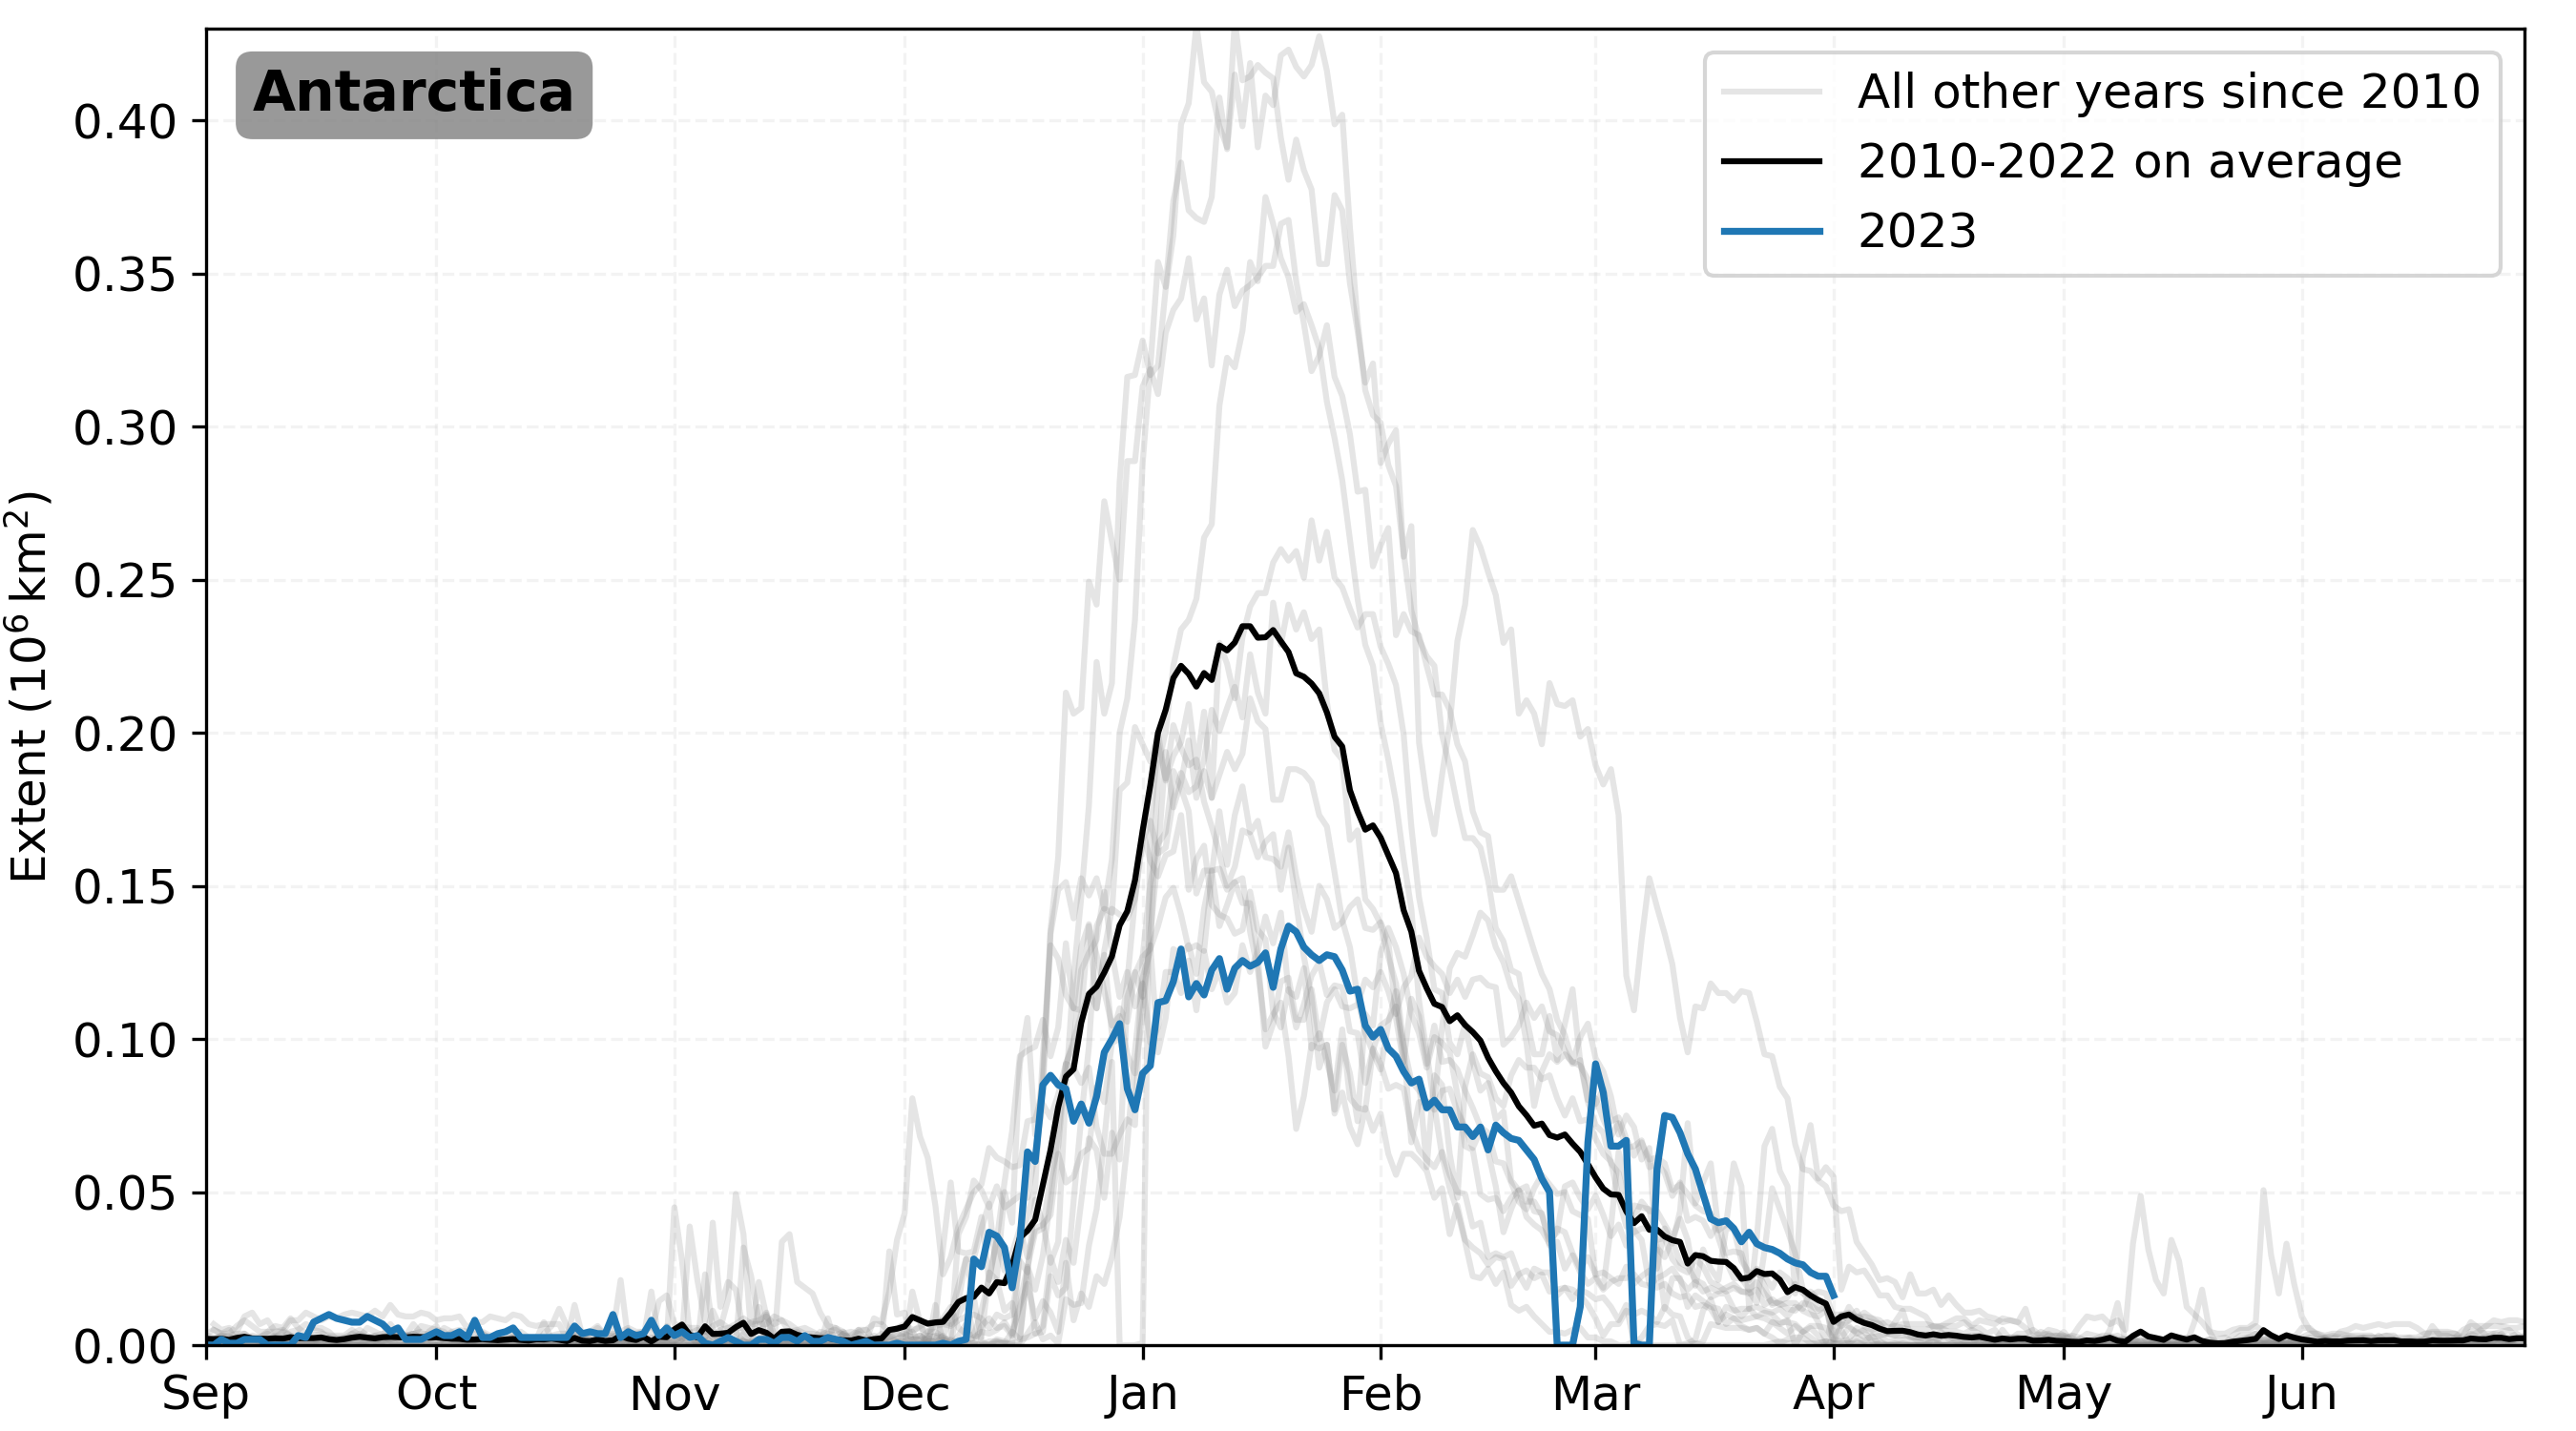
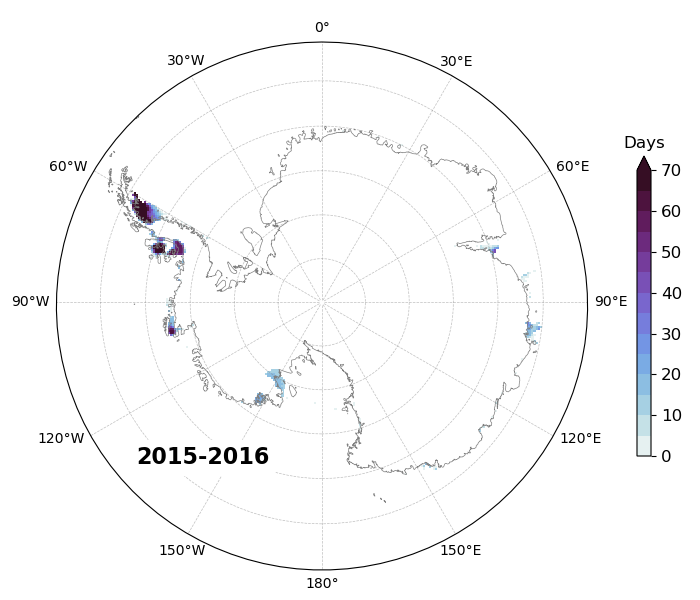
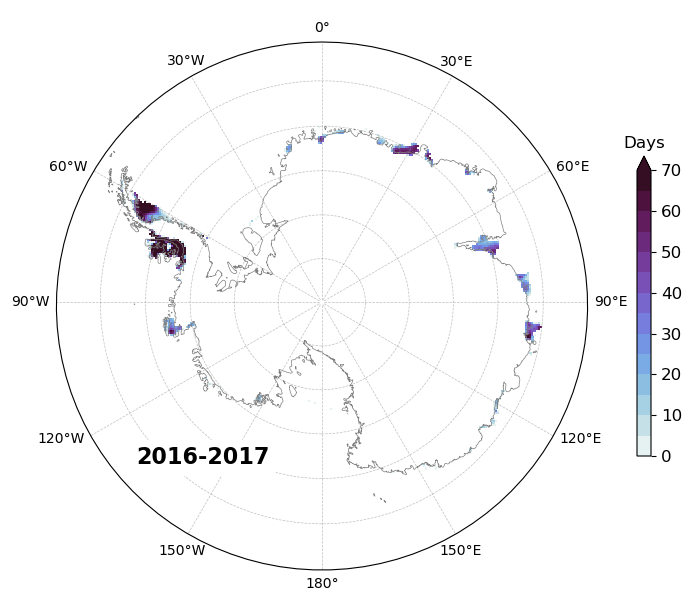
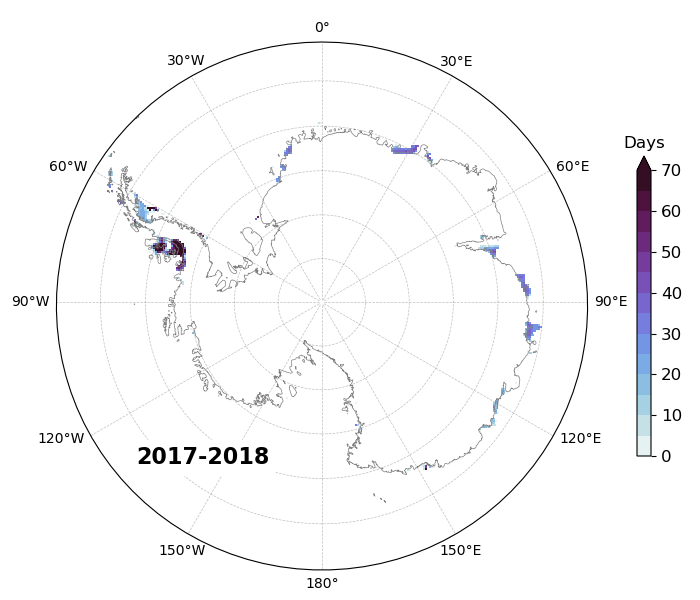
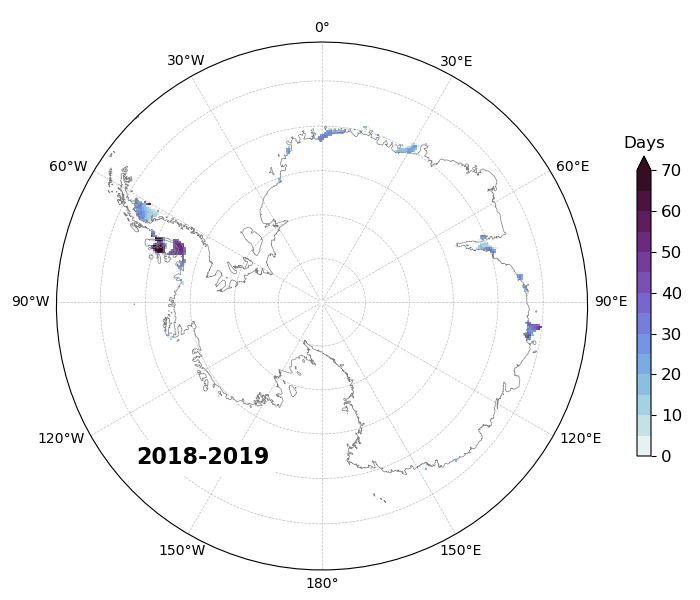
Seasonal evolution
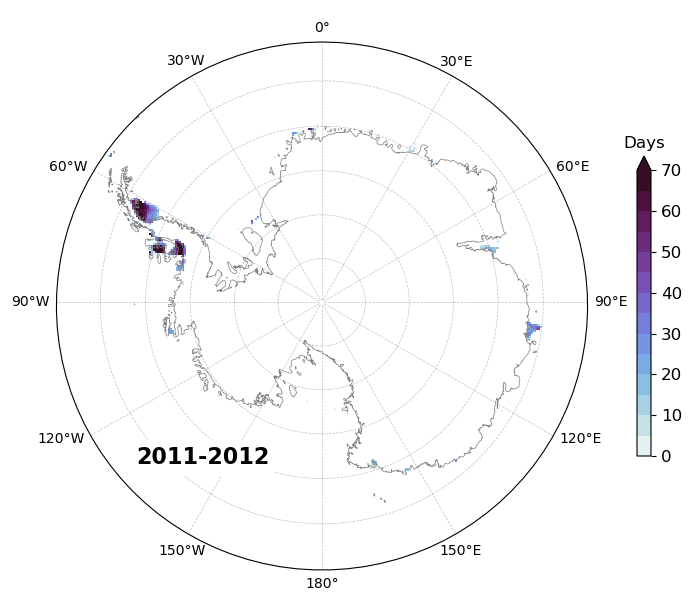
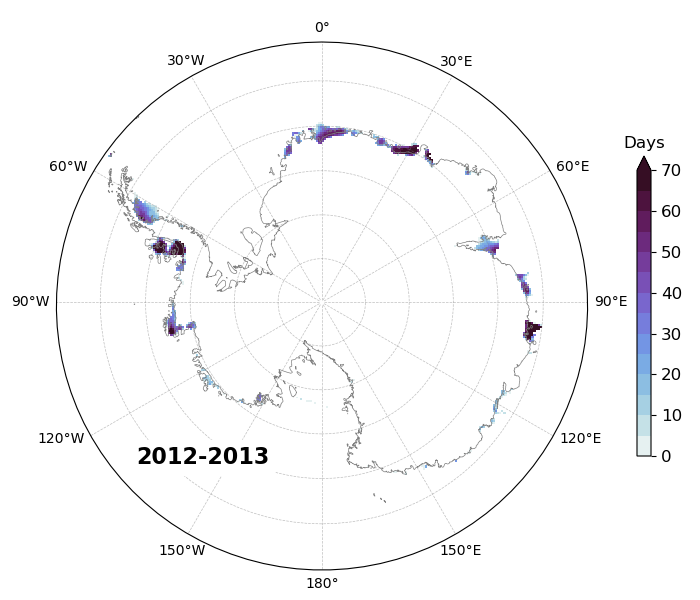
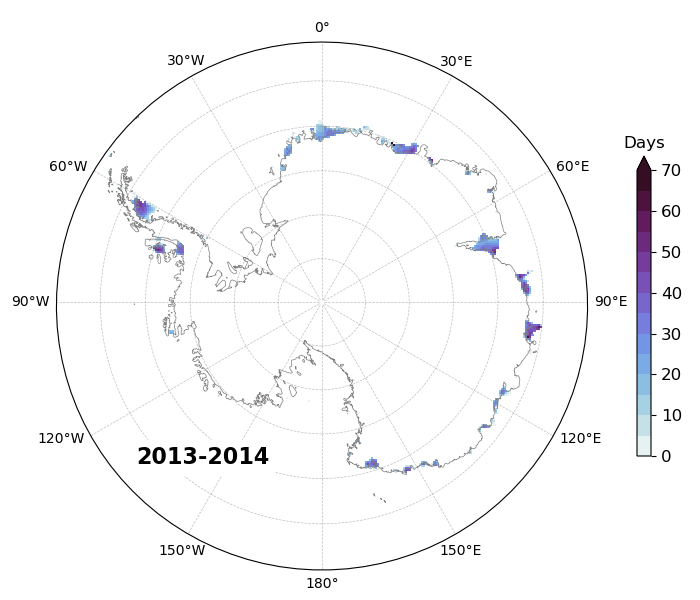
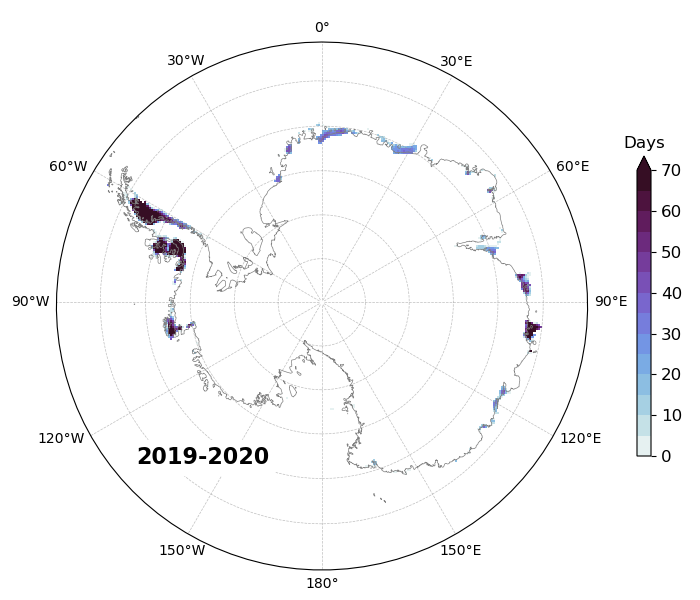
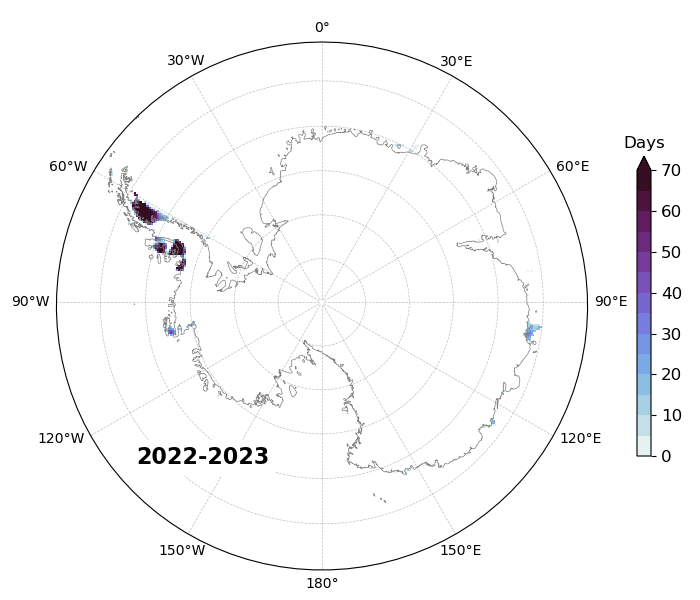
Annual maps


References
Al Bitar A., Mialon A., Kerr Y. H., Cabot F., Richaume P., Jacquette E., Quesney A., Mahmoodi A., Tarot S., Parrens M., Al-Yaari A., Pellarin T., Rodriguez-Fernandez N., Wigneron J.-P., 2017, The global SMOS Level 3 daily soil moisture and brightness temperature maps, Earth System Science Data, 9(1), 293-315, doi:10.5194/essd-9-293-2017.
Brodzik M. J., Billingsley B., Haran T., Raup B., Savoie M. H., 2012, EASE-grid 2.0: incremental but significant improvements for earth-gridded data sets, ISPRS Int. J. Geo-Inf., 1, 32–45, doi:10.3390/ijgi1010032.
Leduc-Leballeur M., Picard G., Macelloni G., Mialon A., Kerr Y. H., 2020, Melt in Antarctica derived from Soil Moisture and Ocean Salinity (SMOS) observations at L band, The Cryosphere, 14, 539–548, doi:10.5194/tc-14-539-2020.
Torinesi O., Fily M., and Genthon C., 2003, Variability and Trends of the Summer Melt Period of Antarctic Ice Margins since 1980 from Microwave Sensors, Journal of Climate, 16(7), 1047-106, doi:10.1175/1520-0442(2003)016<1047:VATOTS>2.0.CO;2.
Acknowledgements
This work benefits from the ESA funding support through various projects (SMOS ESL, CryoSMOS) and contributes to eo science for society.